Oracle ADF - Performance Testing Tools
Following post list some to
ols that can be used for Oracle ADF application performance testing, along with other available tools.
JMeter
JMeter is required in order to make multiple calls to the application. A test plan should be created which specifies the steps to be replicated by the JMeter.
Test plan configured for sample application is attached here
Following are the changes that are required to be done in order to use this test plan with sample application.
1) Open the test plan file in JMeter.
2) Replace the <Server Name or IP> and <Port Number> field corresponding to five HTTP requests that exist in the test plan as shown below, with the details of the server where ADF application is running. This is not required if the application is running on local host
3) Now click on Thread Group – Sample App in order to specify the number of users, loop count per user and the ramp-up time in which the threads should start sending the request to the application.
JDeveloper Memory Profiler
JMeter
JMeter is required in order to make multiple calls to the application. A test plan should be created which specifies the steps to be replicated by the JMeter.
Test plan configured for sample application is attached here
Following are the changes that are required to be done in order to use this test plan with sample application.
1) Open the test plan file in JMeter.
2) Replace the <Server Name or IP> and <Port Number> field corresponding to five HTTP requests that exist in the test plan as shown below, with the details of the server where ADF application is running. This is not required if the application is running on local host
JDeveloper Memory Profiler
JDeveloper memory profiler is required in order to see the number of objects that are getting created in each request and the number of objects that are getting garbage collected. It also displays the number of objects and their size that’s left in the memory after application finishes the requests.
Following are the steps to use JDeveloper memory profiler.
1) Open JDeveloper.
2) Browse the application that is to be analyzed.
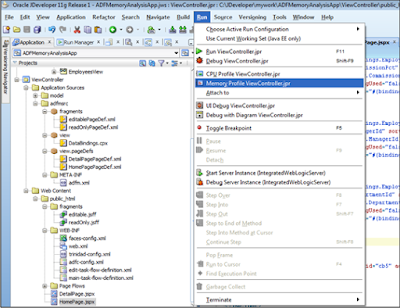
3) Start the memory profiler from the JDeveloper Run menu as shown below.
4) This will start/restart the integrated weblogic server. Once the server is up, the application will start at local host and JDeveloper weblogic port.
5) In order to access the application, either we can directly hit the application from browser or we can use JMeter to hit the application.
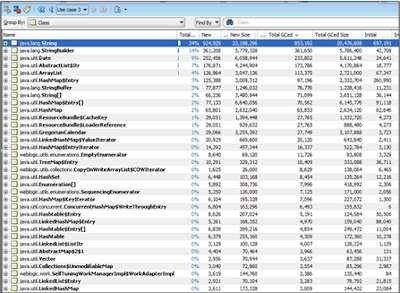
6) Following is a sample report generated using JDeveloper which is showing the total number of instances created and total number of instance collected during garbage collection.
JVisualVM
JVisualVM is required to create the heap dump of the JVM on which the ADF application is deployed and running. The heap dump file generated using JVisualVM can be used to analyze the memory usage, objects count and any suspect for memory leak.
Following are the steps to create the heap dump using JVisualVM
1) Open JVisualVM from the JDK directory like
…/jdk160_29/bin/jvisualvm.exe
2) Select the weblogic server instance on which ADF application is running.
3) Now open the JMeter and click start button to initiate the requests to <ADF application>
4) Analyze the heap allocation and garbage collection activities in JVisualVM.
5) Once the threads started from JMeter complete, click on Heap Dump button to generate the heap dump file.
Eclipse Memory Analyzer
Eclipse memory analyzer is required to analyze the heap dump created using JVisualVM. It helps in identifying the possible issues that might have been reported while running the application.
Following are the steps required to analyze the heap dumps file using Eclipse Memory Analyzer
1) Start the eclipse memory analyzer standalone application or eclipse IDE if it has eclipse memory analyzer plug-in installed.
2) Browse for the heap dump file created above using JVisualVM.
3) Click finish when prompted to generate the Leak suspect report.
4) Click on various other options provided in the IDE to analyze the dump file.
Sample Report
The below screenshot shows the problem suspects in the application.


